
Role
Product Designer
Timeline
08.2022 - 08.2023
Tools
Figma
Dovetail
Slack
Jira
Confluence
Mixpanel
Overview
Cognite is one of Norway's biggest software companies, and it specialized in DataOps for the heavy asset industry (oil and gas, manufacturing). Its world class data platform, Cognite Data Fusion, is designed to free the company's data from its silos and make it useful for all employees that need it.
I worked on multiple projects during my time in Cognite, with very different target users and domains. Yet, the design process and experience were similar and comparable.
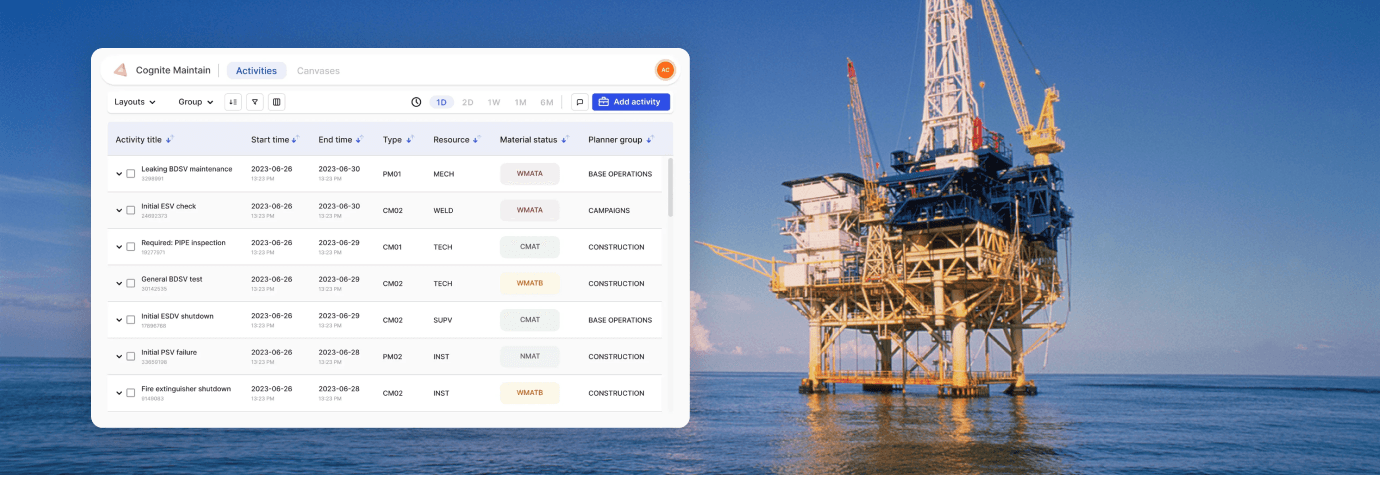
The two main products that I designed for were PowerOps, a platform to assist power traders to place trades on the various electricity markets; and Maintain, a powerful scheduling app for large maintenance efforts.
Both products required us to design interfaces that displayed the vast and complex data the user needed to make high impact decisions.
Design Process
Designing for heavy asset industry means designing for companies with a lot of legacy and complex processes, data that is siloed in different places and a lot of laws and regulations to be mindful of.
For me, this means that each design sprint began with a lot of research, and I would usually spend a good amount of time reading up on domain specifics, sometimes going through legal documents to understand a use case. I benefited a lot from this, because over time I acquired some of the language that our users speak on a daily basis, making interviews and contextual inquires a lot easier and gaining trust and confidence from our customers.
We used Dovetail to help us analyze the research data and find the common threads and main pain points that we wanted to address.
My main focus was then to develop early prototypes based on the insights. These were often times very rudimentary grey boxes that came together as a prototype that I first pitched my senior designs, then to the team and finally tested it with the users.
Design Research
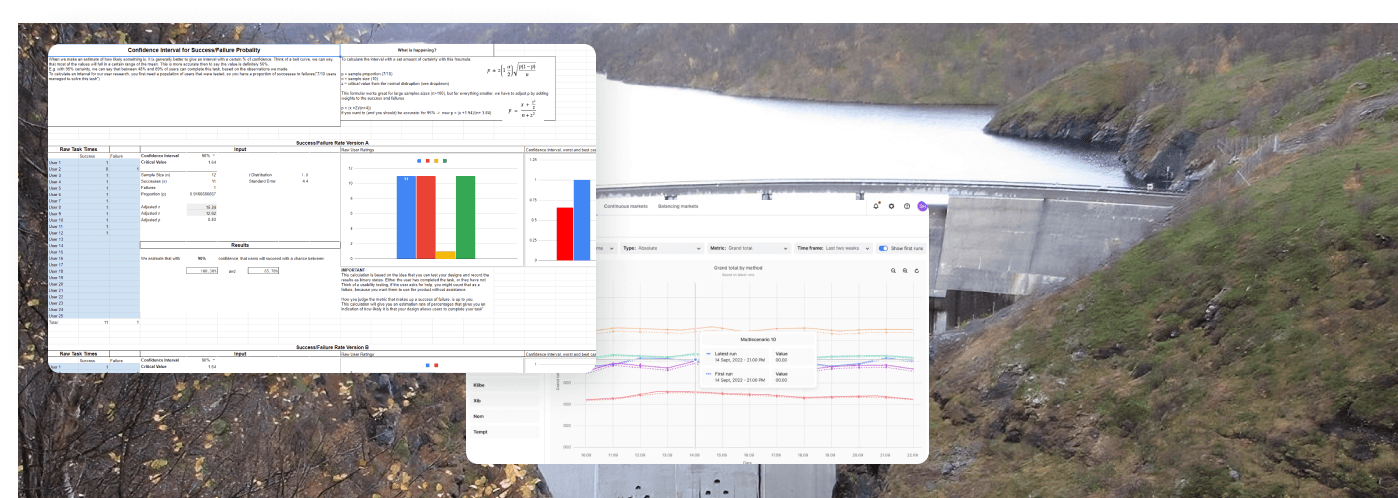
The biggest problem to overcome when designing for a very specific domain, is that your total number of users is quite small. That means, any survey, behaviour data collection, and usability studies, are likely going to be influenced by extremes. I was frustrated by this, because I wanted to measure the impact of our efforts in a reliable way.
To solve this issue, I build a small research calculator that helped me find out the confidence intervals for questions such as "What is the success/failure rate?" or "How long is the average task completion time?". The result of this was presented in company wide presentations.
This was part of a cross team effort to establish a ResearchOps handbook for all designers to follow and use.
© Henri Knutsen. All Rights Reserved 2024.